在上一节中我们通过 /actuator/health 可以看到 hystrix 的状态,actuator 还提供了一个 /actuator/hystrix.stream 端点用来监控 HystrixCommand 。只要开启了 hystrix.stream 权限,就可以通过 /actuator/hystrix.stream 查看 HystrixCommand 的信息。
management:
  endpoints:
    web:
      exposure:
        include: '*'
通过接口返回的是一个 json 格式的 stream ,并不直观,可以借助另一个可视化组件 Hystrix Dashboard 来展示。
首先需要添加依赖。
<dependency>
    <groupId>org.springframework.cloud</groupId>
    <artifactId>spring-cloud-starter-netflix-hystrix-dashboard</artifactId>
</dependency>
然后给启动类加上 @EnableHystrixDashboard ,启动之后访问 http://localhost:8403/hystrix 即可看到界面。
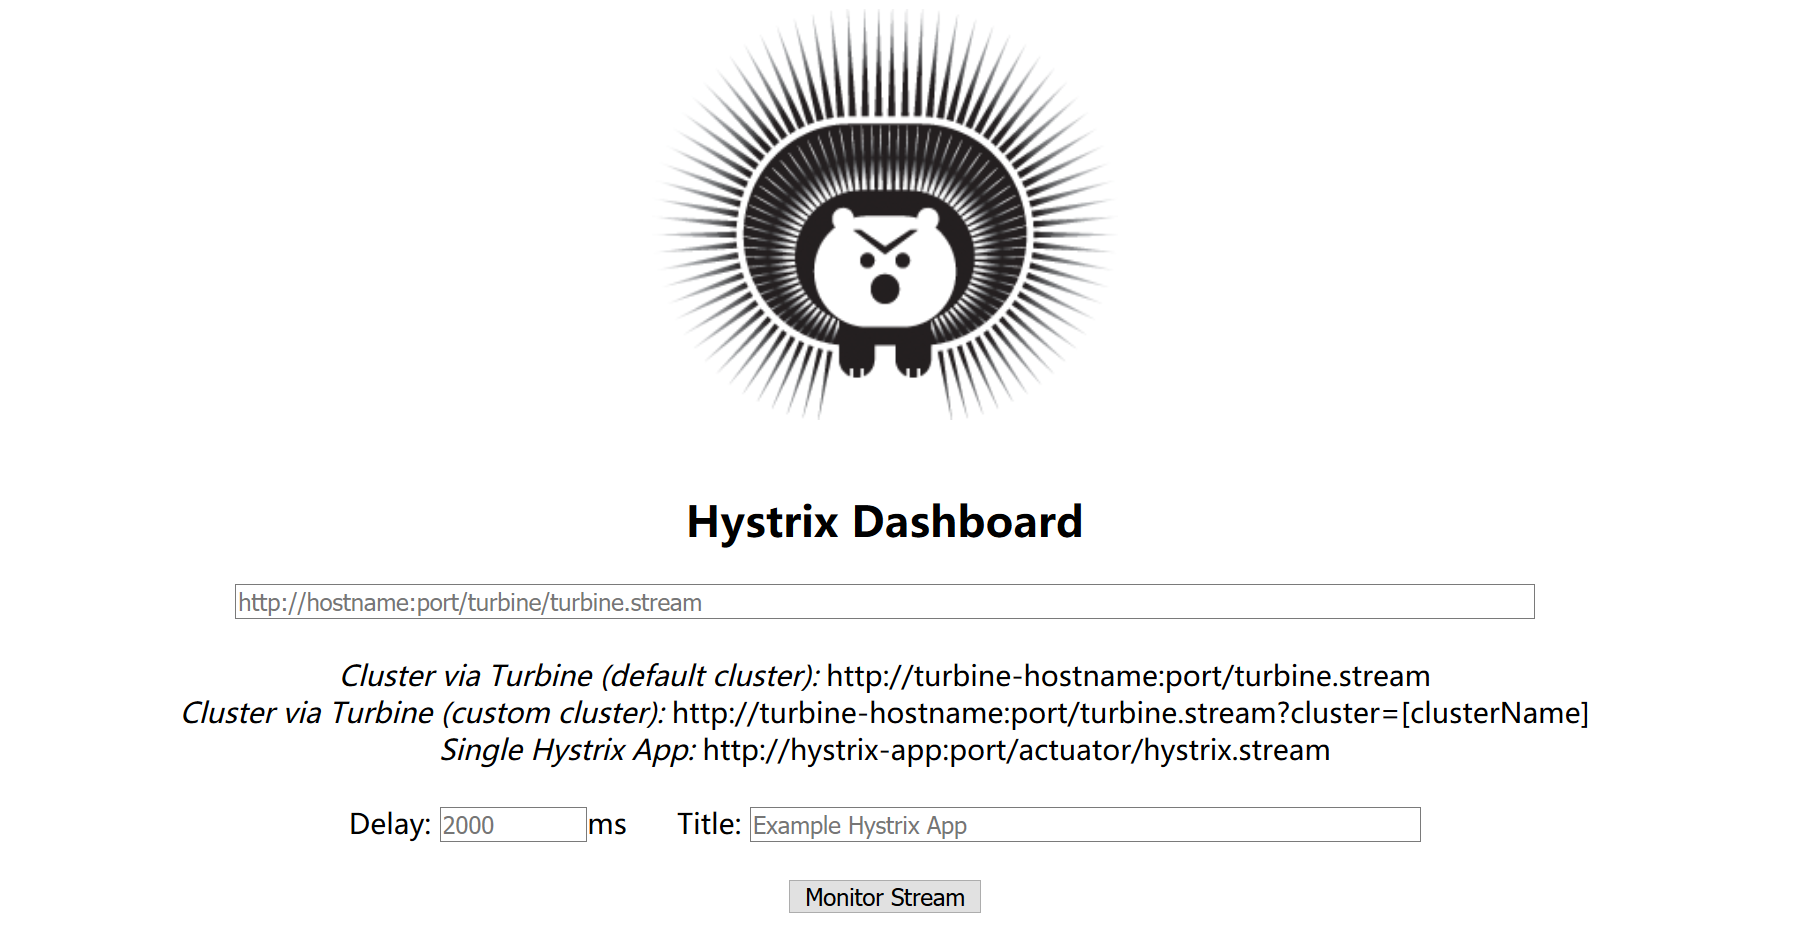
填入相应信息提交,就可以看到监控的图表。
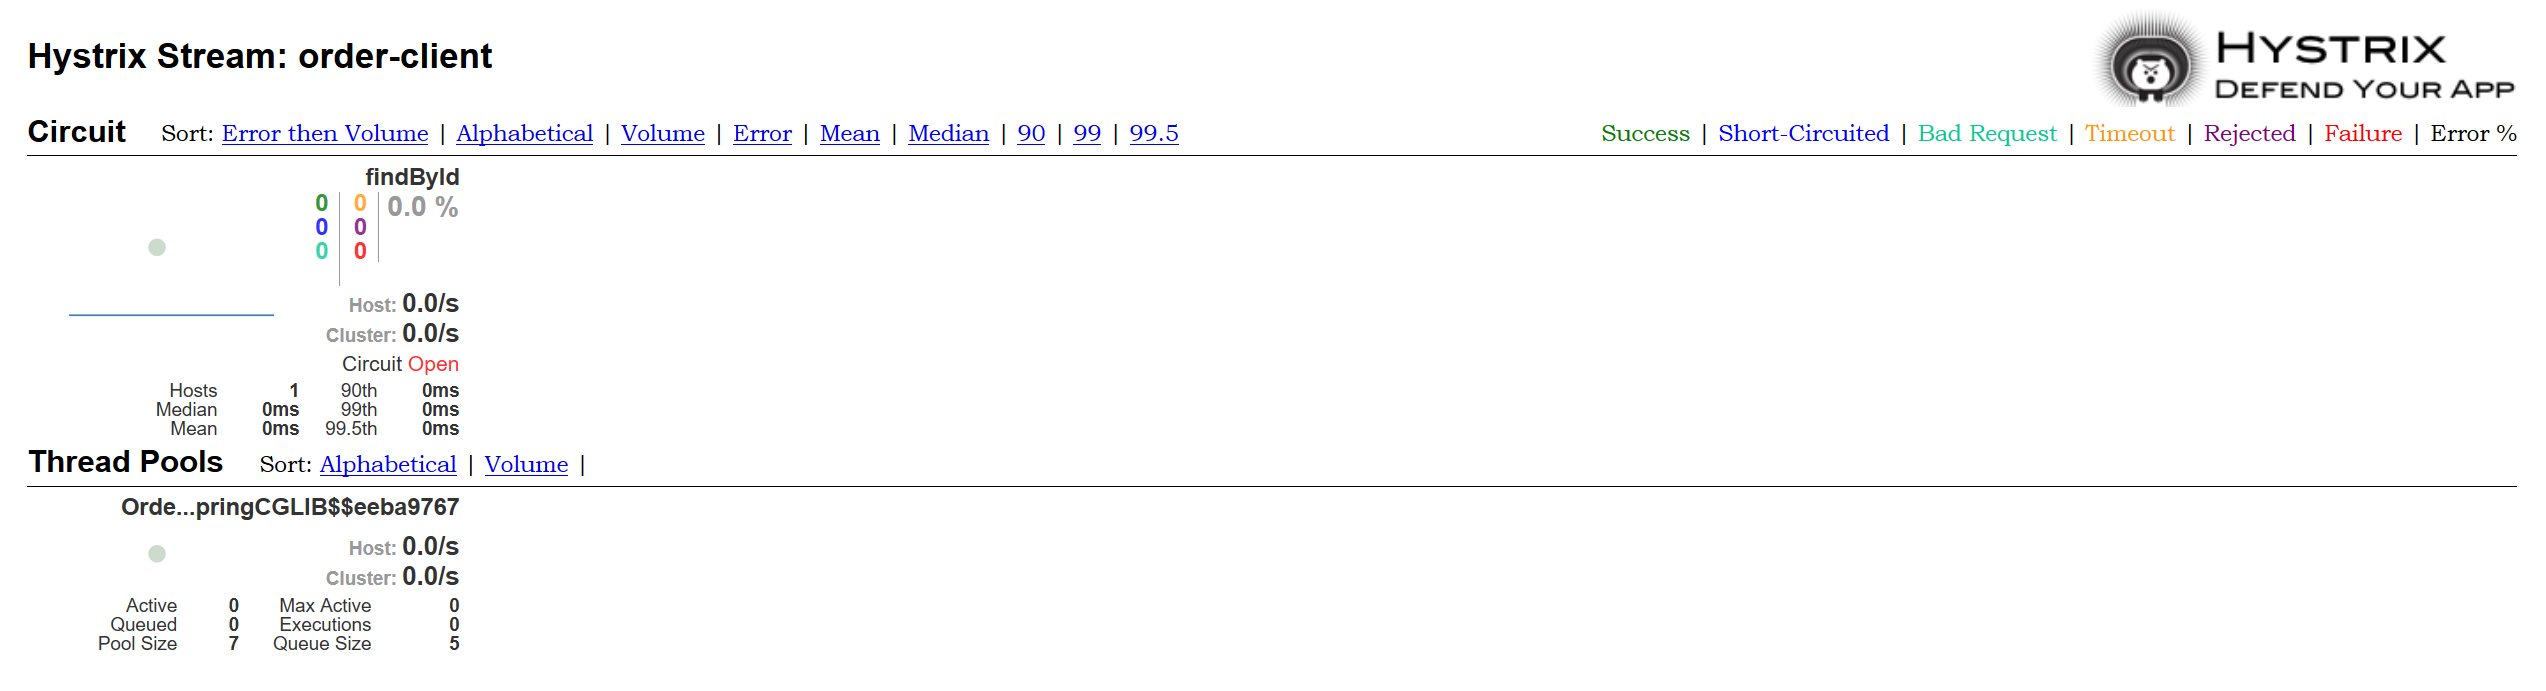
到此,我们就可以通过可视化界面来监控 Hystrix 了。
Turbine
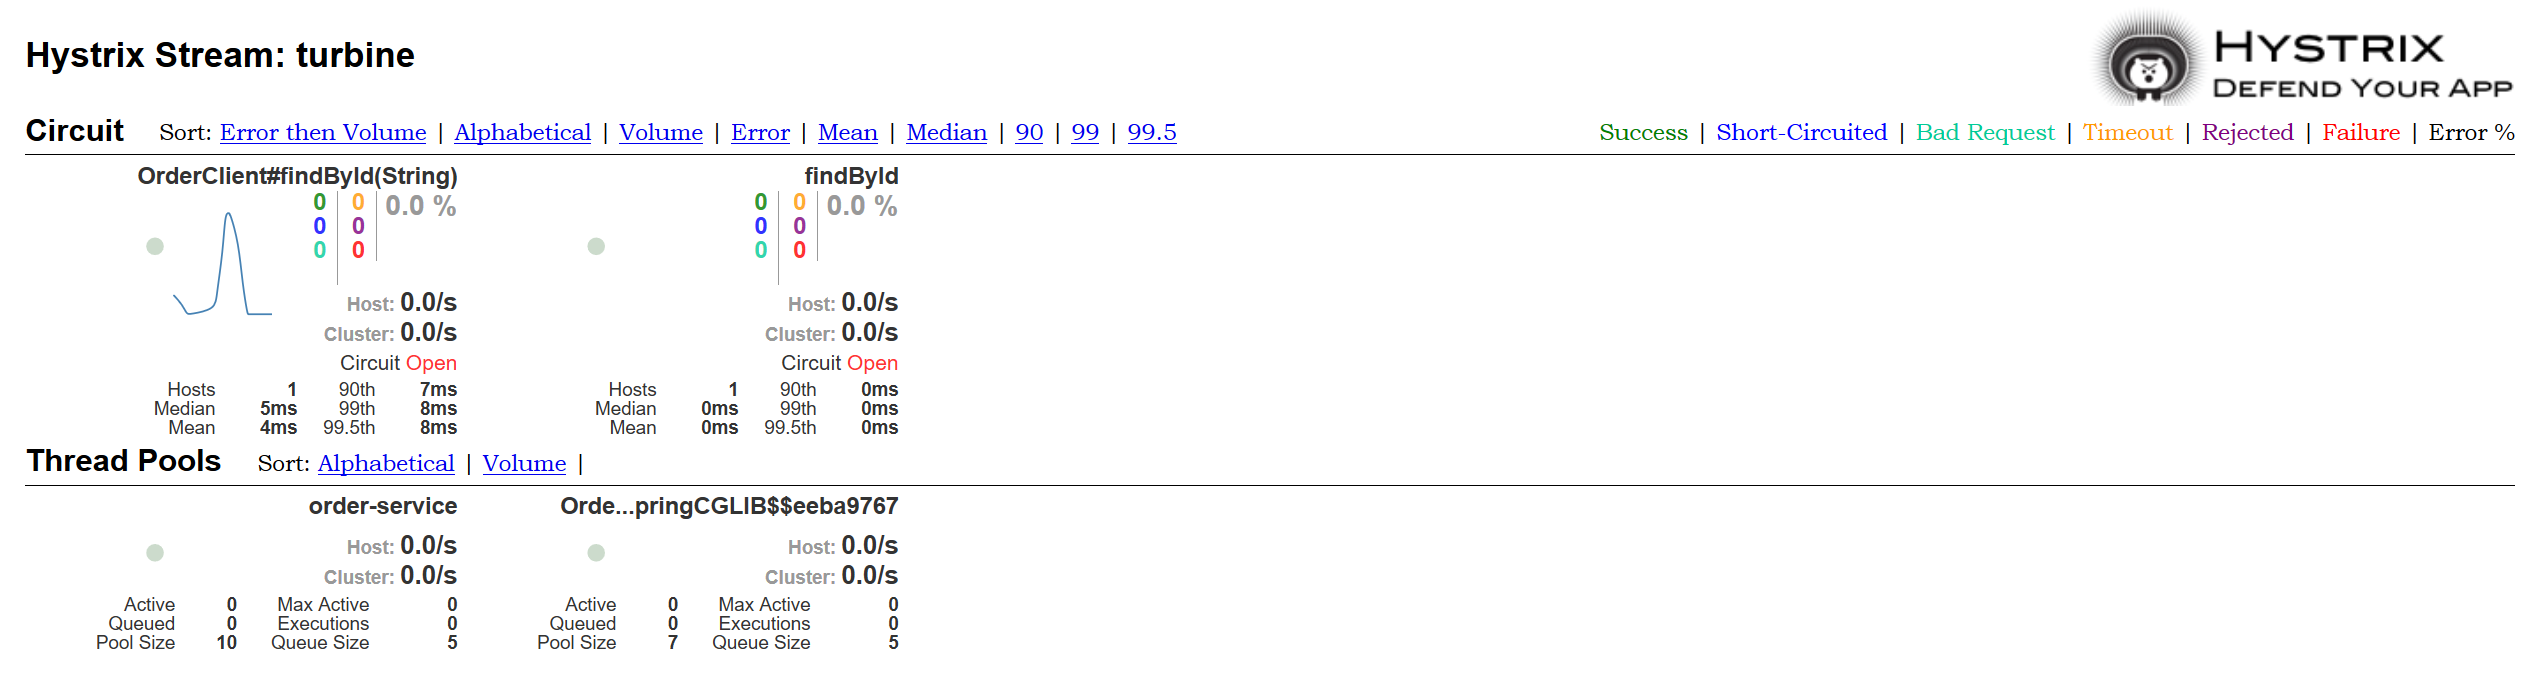
在微服务系统中,用 dashboard 监控单个应用用处并不大,会很不方便,所以我们需要将多个监控信息收集起来统一展示,这就需要用到 Turbine 。
turbine 的使用方式和 hystrix dashboard 类似,首先是添加依赖。
<dependency>
    <groupId>org.springframework.cloud</groupId>
    <artifactId>spring-cloud-starter-netflix-turbine</artifactId>
</dependency>
<dependency>
    <groupId>org.springframework.cloud</groupId>
    <artifactId>spring-cloud-starter-netflix-hystrix-dashboard</artifactId>
</dependency>
然后给启动类添加 @EnableTurbine 和 @EnableHystrixDashboard 注解。最后在配置文件中加入要监控的服务。
turbine:
  # 要监控的微服务列表,多个用,分隔
  appConfig: order-client,feign-order-client
  clusterNameExpression: "'default'"
访问 hystrix dashboard 输入 http://localhost:8500/turbine.stream 就可以看到收集的信息了。